Reading two overlapping organic search reports
Two Google Search Console captures show how clicks, impressions and click-through rates change when the reporting dates overlap.
- Timeline
- April to August 2022, in two overlapping reports
Problem
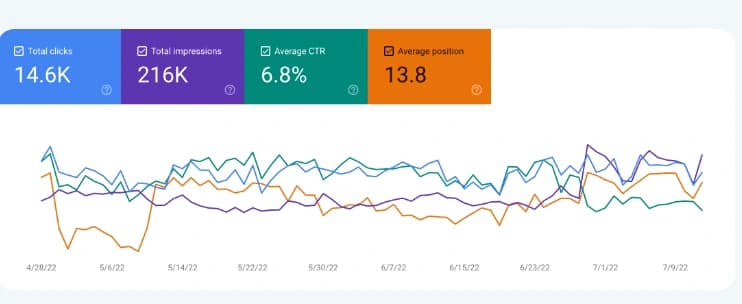
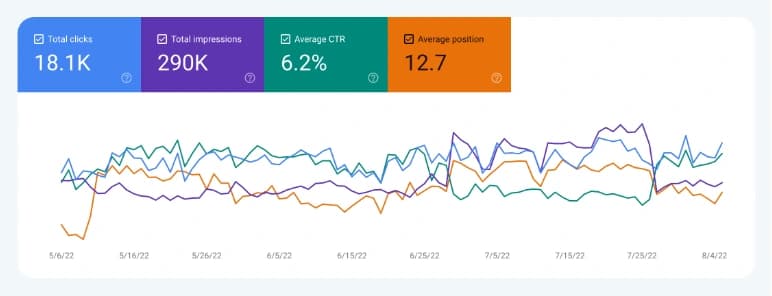
A report showing 18.1K clicks and another showing 14.6K can look like two consecutive periods. Before drawing a conclusion, look at the date axis. These two charts both include May, June and part of July 2022.
What we did
Nafas Hashemiyan’s portfolio includes an April to July report with 216K impressions, 14.6K clicks and a 6.8% click-through rate. The May to August report shows 290K impressions, 18.1K clicks and a 6.2% click-through rate. Each chart has a different set of dates contributing to its totals.
The second report has more clicks and a lower click-through rate. Both can be true because the rate expresses clicks as a share of impressions. Adding the two click totals would count the overlapping days twice if the reports cover the same property. The property name is outside both captures.
To investigate a change like this, use the same Search Console property and search type, then select two distinct periods of equal length. Query and page detail can show which searches account for the difference.
Results
- 14.6K clicks from 216K impressions in the April to July 2022 capture, with 6.8% CTR and average position 13.8
- 18.1K clicks from 290K impressions in the May to August 2022 capture, with 6.2% CTR and average position 12.7
Services used